Ulubione (0)
Koszyk
(0)
(0)
Brak produktów
Do ustalenia
Wysyłka
0,00 zł
Razem
Produkt dodany poprawnie do Twojego koszyka
Ilość
Razem
Ilość produktów w Twoim koszyku: 0.
Jest 1 produkt w Twoim koszyku.
Razem produkty:
Dostawa:
Do ustalenia
Razem
Fototapety na wymiar
-
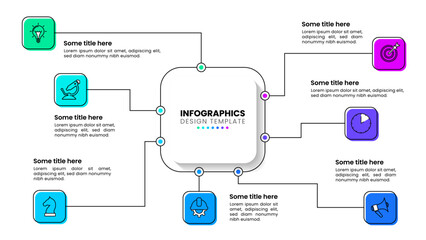
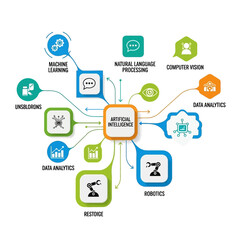 An infographic illustrating the concept of artificial intelligence and its various applications
 -
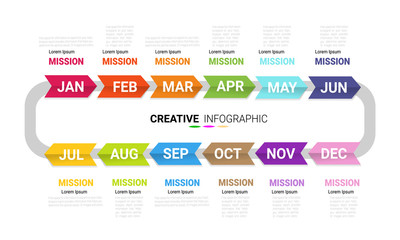 Time line for 1 year, 12 months, Timeline infographics design vector 12 steps and Presentation business can be used for Business concept with 12 options, steps or processes.
 -
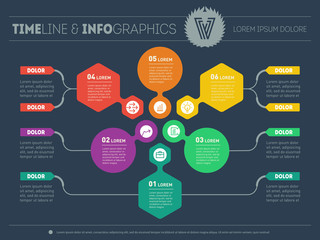
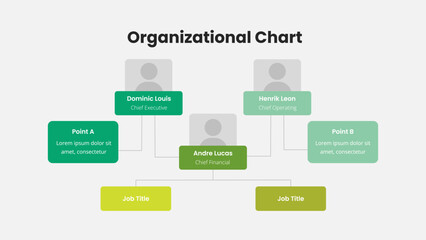 Company Hierarchy Infographic
 -
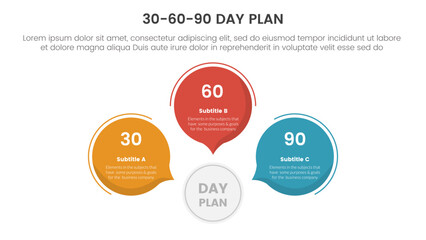 30 60 90 day plan management infographic 3 point stage template with circle callout comment shape for slide presentation
 -
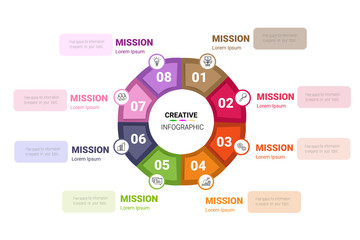
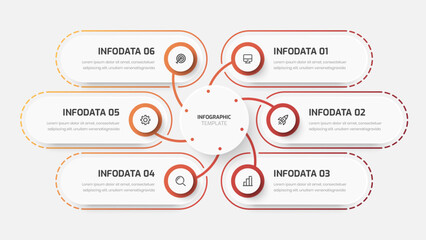 Business Central Circle, Infographic Presentation with Gradient Color, Circle Label, 6 Options, Line and Icon
 -
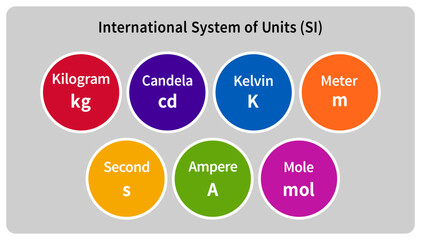 International System of Measurement. The seven SI base unit is the fundament of today's science and technology.
 -
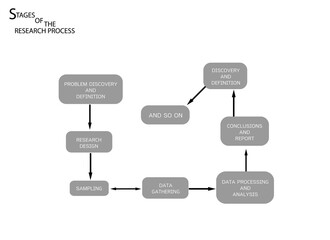 Business and Marketing or Social Research Process, 8 Step of Qualitative Research Methods Isolated on White Background
 -
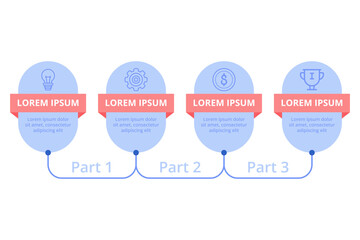 Infographic presenting three separate concepts connected by lines. Each section including icon and placeholder text, illustrating straightforward visual point of information
 -
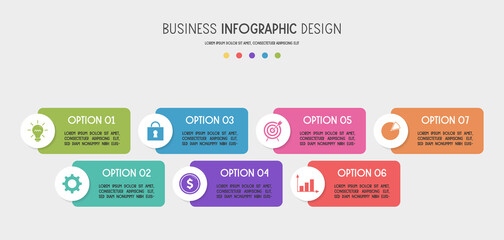
 Infographic template. Technology concept with 7 connected steps
 -
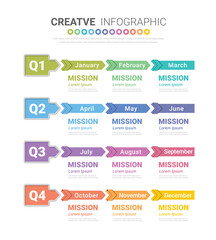 Timeline presentation for 12 months in 4 quarter, 1 year, Timeline infographics design vector and Presentation business can be used for Business concept with 12 options, steps or processes.
 -
 Web Template of a pyramidal chart, diagram or presentation. Busi
 -
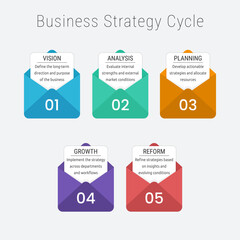 Business strategy cycle vector infographic with colorful envelopes
 -
 Circle Infographic thin line design and 8 options or steps. Infographics for business concept.
 -
 Colourful infographic with icons. Vector
 -
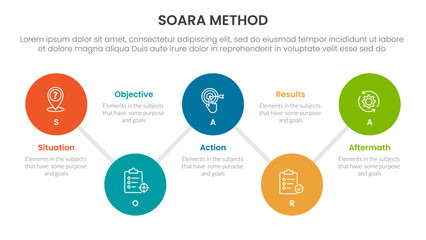 SOARA interviewing method infographic template banner with timeline big circle connection line up and down with 5 point list information for slide presentation
 -
 Steps 6 six or option 6 six infographic design. business infographic concept for presentations, banner, workflow layout, process diagram, flow chart and how it work
 -
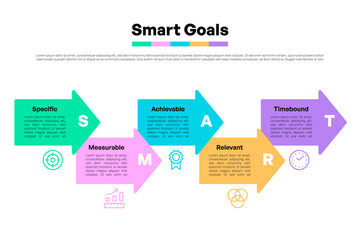 SMART Goals Infographic with Colorful Arrows and Icons for Project Management
 -
 Vector Infographic label design template with icons and 2 options or steps.
 -
 Infographic design template with numbers Six 6 Steps, Six 6 option for Presentation infographic, Timeline infographics, steps or processes. Vector illustration.
 -
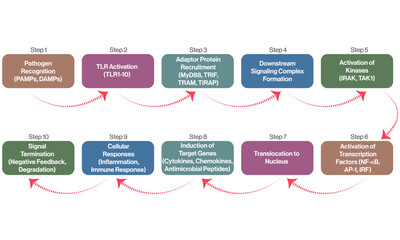 Detailed Flowchart of Toll Like Receptor Pathways, Science Vector Illustration on White Background.
 -
 colorful timeline infographic with Six 6 Steps, Six 6 options design template, Infographics management, finance, analytics, presentation. Vector illustration
 -
 Abstract infographics template.
 -
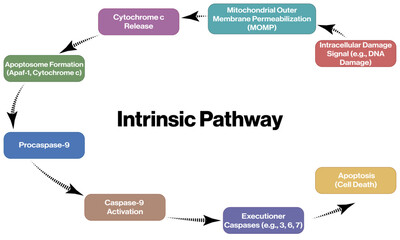 Detailed Flowchart of Intrinsic Apoptosis Pathway in White Background, Vector Illustration for Mitochondria-Mediated Cell Death Mechanisms and Molecular Biology.
 -
 weekly planner, Timeline business for 7 day, Presentation business can be used for Business concept with 7 options, steps or processes.
 -
 Infographic illustrating a six-step process represented by six circles arranged in a circular shape
 -
 Infographic template with numbers 6 option can be used for workflow layout, diagram, number step up options.
 -
 Business presentation or infographic with 7 options. Web Template of a chart, mindmap or diagram. Vector infographics or mind map of technology or education process.
 -
 Diagram template with three steps or options, workflow, process chart, infographic template for web, business, presentations